Press kit
Independent data on brokers, prop firms and crypto exchanges. Every figure comes from a primary source, linked and dated.
No figures on this page. So it never goes out of date. For current numbers, use the dataset page: it always carries the latest reading, its caveats and its sources.
Data you can cite
CFD Loss-Rate Series
Each CFD provider's own figure for the share of its retail accounts that lose money, from its regulator-mandated risk warning. Quarterly history comes from archived copies of its website.
- Dataset page
- /brokers/cfd-loss-rates/
- Version
- 1.0.0 Provisional release, data as of
- Providers
- 31
Downloads
- cfd-loss-rates.csvCSV. One row per provider: figure, verbatim warning, entity, page, date read.
- cfd-loss-rates-history.csvCSV. One archived figure per provider per quarter, with its Wayback Machine link.
- cfd-loss-rates-summary.jsonJSON. Count, median, range and change since the earliest archived figure.
- cfd-loss-rates.datapackage.jsonJSON. Field definitions, licence and sources.
Our other datasets
- UK crypto licence trackerWhich crypto platforms used in the UK are on the FCA's cryptoasset register or Warning List.
- Prop firm pass and payout ratesEvery rate a prop firm prints on its own website, quoted word for word.
- US Futures Prop Access LedgerPrices, fees and payout terms at futures prop firms, read from a US address.
- Crowd GaugeHow crowded small traders are, long or short, from the CFTC's Commitments of Traders report.
Every dataset, with its files and licence: open data. Each dataset page has its own "Cite this" box.
Charts
- Free under CC BY 4.0
- 1200×675 for articles
- 1080×1080 for social
- Data date in the file name
- Alt text ready to paste
Credit line: "Source: TradingLookup, CC BY 4.0".
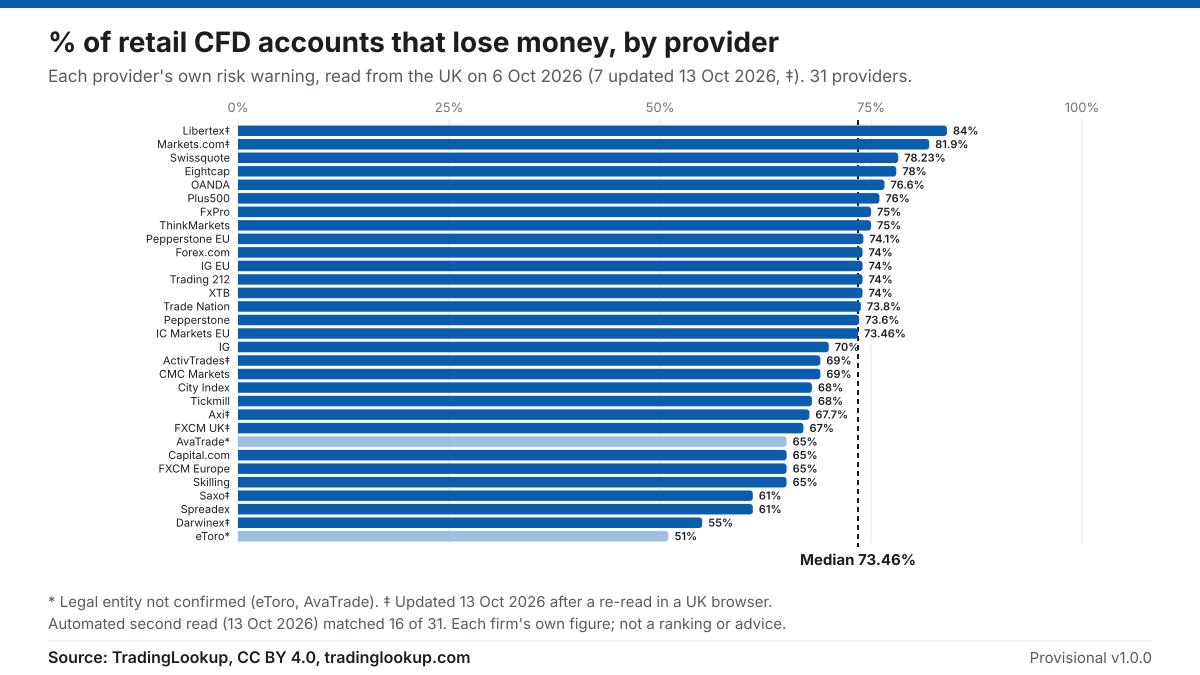
Ranked chart. Every provider's own figure, highest to lowest, with the median. Download: 1200×675 PNG · 1080×1080 PNG
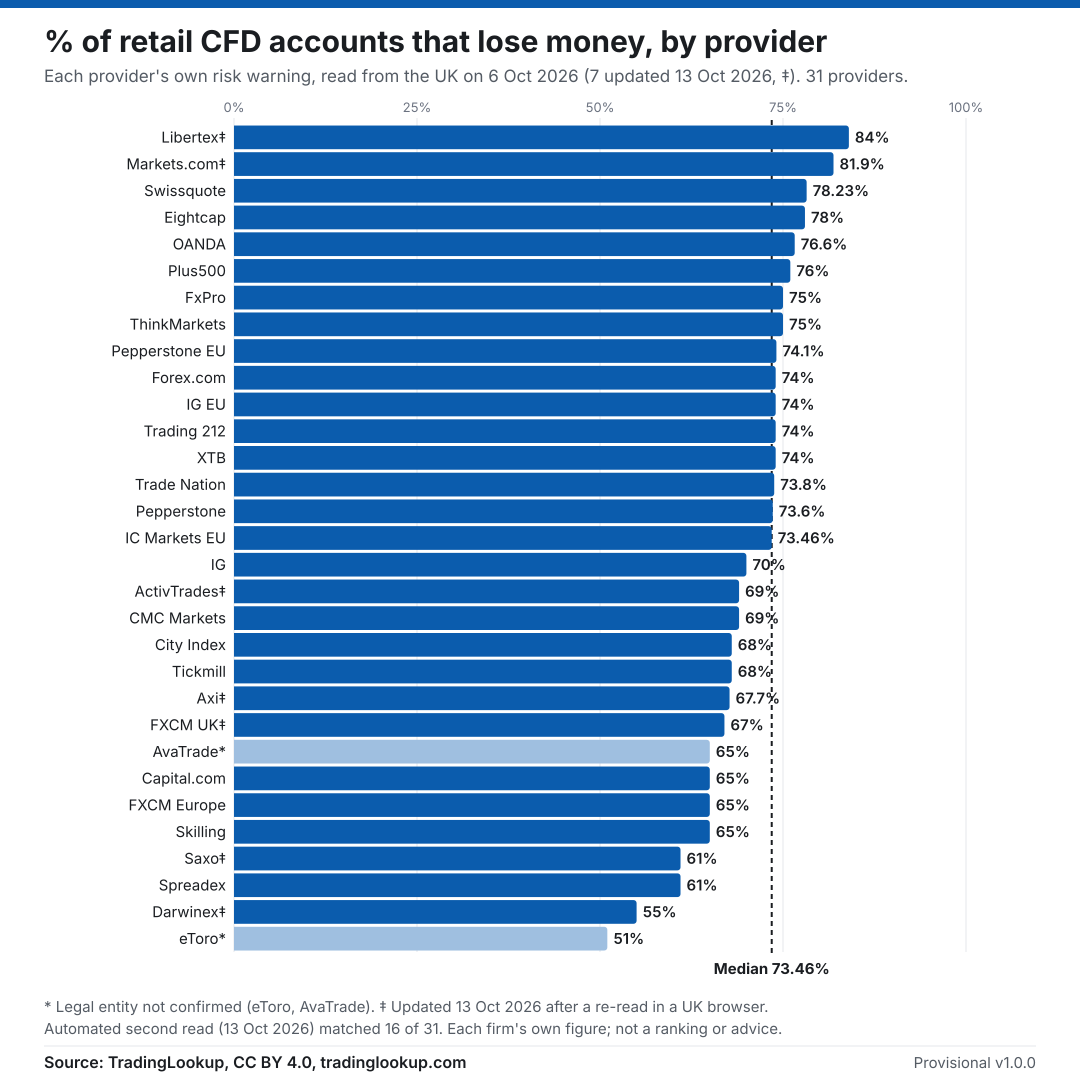
Bar chart of 31 CFD providers' own figures for the share of retail accounts that lose money, read from the UK on 6 October 2026 (7 updated on 13 October 2026). Highest Libertex 84%, lowest eToro 51% (entity not confirmed); median 73.46%. Source: TradingLookup, CC BY 4.0.
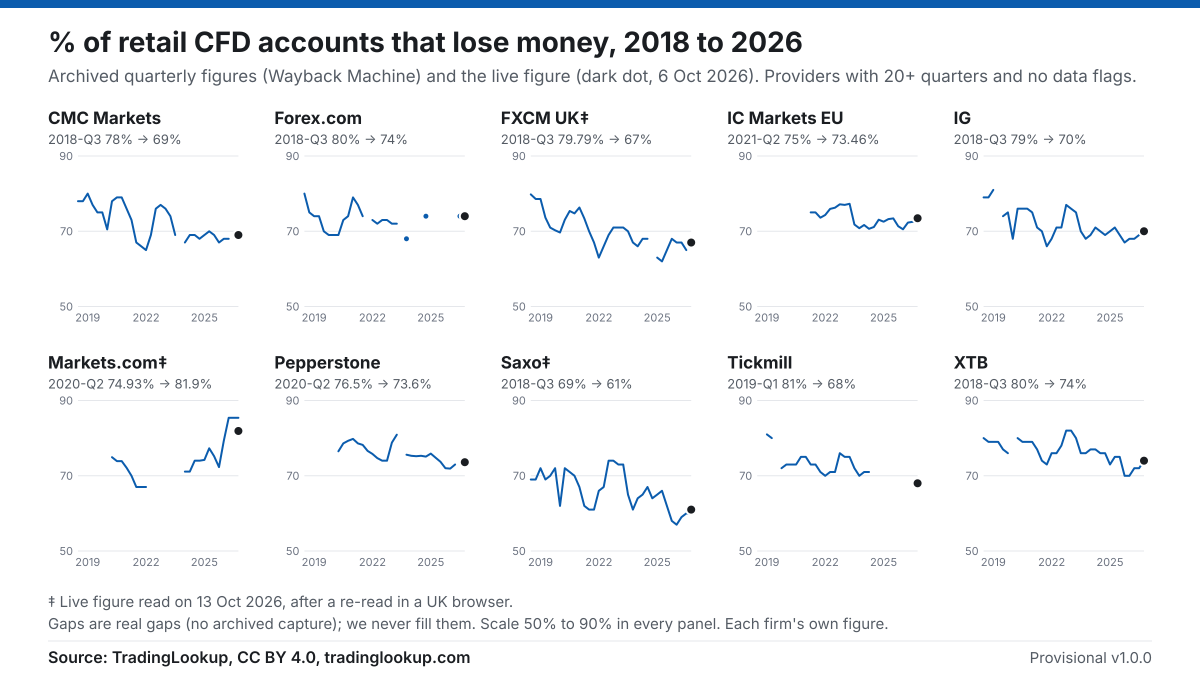
History chart. Ten providers' archived quarterly figures since 2018, with today's figure. Download: 1200×675 PNG · 1080×1080 PNG
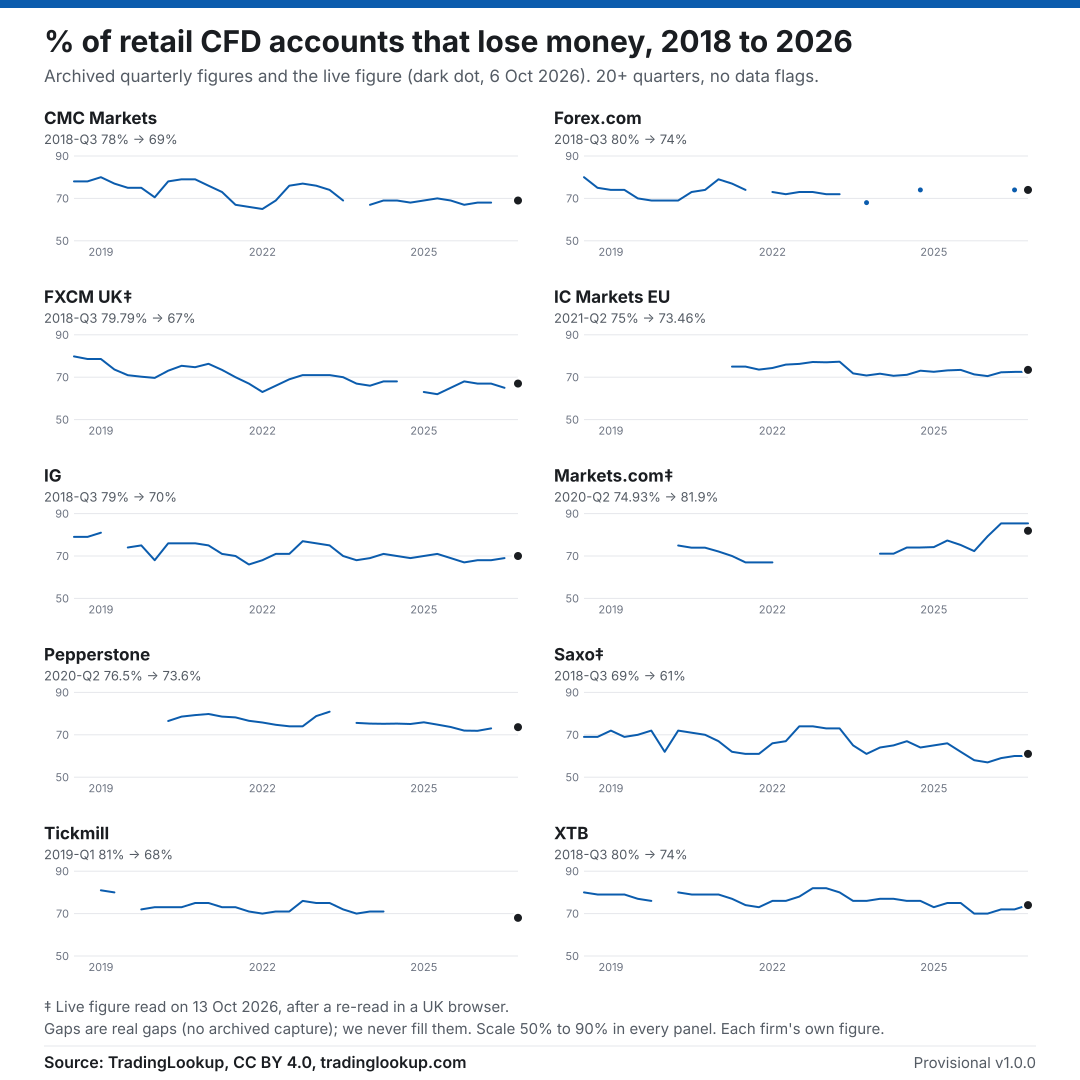
Ten small line charts of each provider's archived quarterly loss-rate figure from 2018 to 2026 (CMC Markets, Forex.com, FXCM UK, IC Markets EU, IG, Markets.com, Pepperstone, Saxo, Tickmill, XTB), with the live figure as a dark dot (FXCM UK, Markets.com and Saxo live figures read on 13 October 2026). Source: TradingLookup, CC BY 4.0.
How to cite
Suggested citation (add the date you accessed it)
TradingLookup (2026). CFD loss-rate series, v1.0.0 (provisional: not every figure confirmed on a second read), data as of 6 October 2026. https://tradinglookup.com/brokers/cfd-loss-rates/. Licence: CC BY 4.0. Accessed [day month year].
- In text"according to TradingLookup's CFD Loss-Rate Series", with a link to the dataset page.
- Charts"Source: TradingLookup, CC BY 4.0".
- Quoting a figureTake it from the dataset page on the day you write, and give its date. Firms refresh these figures every quarter.
Method, corrections and independence
- CFD series methodHow the series is built, and its limits.
- How we check our dataSources, checks and dates, site-wide.
- CorrectionsEvery fix we make, in public.
- Right of replyHow firms can reply.
- How we make moneyData pages carry no affiliate links, and nobody can pay to change a figure.
- AboutWho runs TradingLookup.
Logo

Our mark, for use when writing about TradingLookup: 512×512 PNG · SVG. The name is one word: TradingLookup.

Press contact
Email hello@tradinglookup.com for questions about the data, a custom cut, the method or a correction. We can't give personal financial advice.