

State of retail CFD losses
 By Sydney Stones (data and method lead) Last updated Data read by our script
How we got this
How: A report over our CFD Loss-Rate Ledger: 31 providers' own risk-warning figures, read by our script from the UK, and their archived figures from the Internet Archive. Provisional release. How we checkHow we make moneyCorrections
Provisional. Every figure here comes from our ledger's provisional release: read by our script, with a second automated read; no figure has yet been signed off by a person. The ledger shows each provider's figure with its source.
Median stated loss figure, retail CFD accounts
73.46%measured
last updated 13 Oct 2026
Details: Median stated loss figure, retail CFD accounts
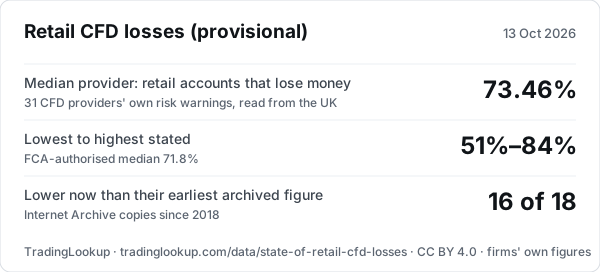
Across 31 CFD providers read from the UK, the median provider's risk warning said 73.46% of retail accounts lose money (range 51% to 84%); 16 of 18 providers with an archived figure now state a lower one than their earliest, according to TradingLookup's State of retail CFD losses (October 2026).
- Providers
- 31, read from the UK
- Median
- 73.46%; mean 70.4%
- Range
- 51% to 84%
- Earliest vs now
- 16 of 18 lower, 2 higher; median change -6.0 points
- Read on
- 13 October 2026
CFD risk warning CFDs are complex instruments and come with a high risk of losing money rapidly due to leverage. Each figure is the firm's own statement about its retail clients. Data, not advice.
How the figures spread
By regulator
Quarter by quarter since 2018
| Quarter | Median stated loss figure | Providers archived |
|---|---|---|
| 2026-Q3 | 70.5% | 10 |
| 2026-Q2 | 71% | 12 |
| 2026-Q1 | 69.5% | 12 |
| 2025-Q4 | 70% | 13 |
| 2025-Q3 | 71.21% | 12 |
| 2025-Q2 | 73.22% | 11 |
| 2025-Q1 | 71.27% | 12 |
| 2024-Q4 | 73.54% | 12 |
| 2024-Q3 | 71% | 11 |
| 2024-Q2 | 71% | 13 |
| 2024-Q1 | 70% | 12 |
| 2023-Q4 | 70% | 12 |
Last 12 quarters shown; every quarter is in the CSV below. Each firm's own history: quarterly history on the ledger.
How it's built
- Current figuresThe loss figure in each provider's own risk warning on its UK site, read by our script on 13 October 2026, as published in the CFD Loss-Rate Ledger.
- HistoryThe same warnings in Internet Archive copies, one per provider per quarter where one exists.
- Our sumsMedians, bands, regulator groups and the earliest-vs-now count. Firms that publish no figure are left out (7 on the last read).
- What the figure isEach firm's own statement about its retail clients over a period the firm chooses, usually 12 months. Firms work it out in different ways, so small gaps between firms mean little.
Related: CFD Loss-Rate Ledger · how we read the figures · state of prop firms
Download the data
CSV and JSON, free to use, share and adapt under CC BY 4.0. Please credit TradingLookup and link to this page. Every file carries its build date; the source series are named in the JSON and on the data hub.
Embed the figures
Cite this
CC BY 4.0
Free to use, share and adapt under Creative Commons Attribution 4.0 (CC BY 4.0). Please credit TradingLookup and link to this page.
Suggested citation
TradingLookup (2026). State of retail CFD losses, October 2026 (provisional), from the CFD Loss-Rate Ledger v1.0.0. https://tradinglookup.com/data/state-of-retail-cfd-losses/. Source: each provider's own risk warning; archived copies from the Internet Archive.
Quotable line permanent link: /data/state-of-retail-cfd-losses/#stat
Across 31 CFD providers read from the UK, the median provider's risk warning said 73.46% of retail accounts lose money (range 51% to 84%); 16 of 18 providers with an archived figure now state a lower one than their earliest, according to TradingLookup's State of retail CFD losses (October 2026).
Data, not advice. These are firms' own statements about past client results; they don't predict your result.
More TradingLookup data tools
- Is the yield curve inverted?US Treasury 10y–2y and 10y–3m spreads, every inversion since 1976. +0.32 pp · 10y minus 2y
- 5-year Treasury yieldThe US 5-year Treasury yield, daily since 1962, with its 52-week range. 4.67% · 5-year yield
- 10-year Treasury yield chartThe US 10-year Treasury yield, daily since 1962, with its 52-week range. 4.88% · 10-year yield
- Inflation and real ratesUS CPI and PCE inflation, the 10-year real yield and the breakeven rate. 3.7% · CPI inflation, Sept 2026
- Fed rate history and FOMC datesEvery change in the Fed's target since 1994, and the next meetings. 3.75–4.00% · Fed funds target range
- Crypto and markets correlation matrixHow bitcoin and ether moved with the broad dollar index, yields and oil, 90 days and a year. −0.31 · bitcoin vs broad dollar index, 90 days
- Stablecoin supply, on-chainSupply of the main USD stablecoins, read from each token contract. $264.8bn · 8 stablecoins, 18 contracts
- Prop Firm Price IndexMonthly: the median cost to a funded $50K US futures prop account, one dated edition per month, using each firm's own price without a promo code where the page ties the shown price to a code. $170 · median, 39 of 50 firms, provisional
- State of prop firmsPrices, pass and payout rates and US access across our prop firm ledgers. 9 of 53 · firms that publish a pass rate, provisional
- Economic calendarCentral bank decisions and major data releases, dated from each publisher's own page. 25 Nov · next high-impact: US GDP
All of them, with every dataset: the data hub.