

Fed funds rate history and FOMC dates
What is the Fed funds rate now?
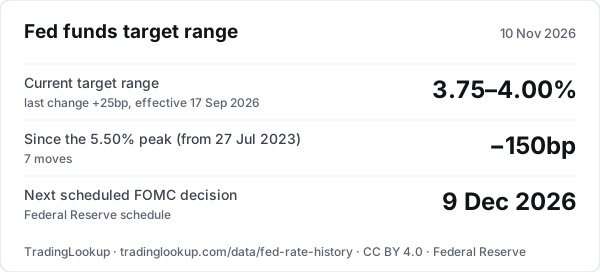
3.75–4.00%
The target range set by the FOMC. Last decision (28 Oct 2026): held. Last change: +25bp, in effect from 17 Sep 2026. Next scheduled decision: 9 Dec 2026.
Read · Federal Reserve · Link to this fact
 By Sydney Stones (data and method lead) Last updated Data read by our script
How we got this
How: Built by our script from the Federal Reserve Board's published target (via FRED) and the Fed's own FOMC calendar page. We list every day the target changed and count the moves. How we checkHow we make moneyCorrections
What did the Fed decide at its last meeting?
Held at 3.75–4.00%
At its October 2026 meeting, decided on 28 Oct 2026, the FOMC kept the federal funds target range at 3.75–4.00%. Read from the Fed's target range as published to 10 Nov 2026.
When is the next FOMC meeting?
9 Dec 2026
Decision day of the December 2026 meeting. The one after: 27 Jan 2027.
Federal funds target range
3.75–4.00%measured
last updated 10 Nov 2026
Details: Federal funds target range
The Federal Reserve's federal funds target range was 3.75–4.00% on 10 November 2026, after a +25bp change that took effect on 17 September 2026; since 1994 the target has changed 92 times (52 rises, 40 cuts), according to TradingLookup's Fed rate history (November 2026).
- Target range
- 3.75–4.00% on 10 November 2026
- Last FOMC decision
- held at 3.75–4.00%, 28 October 2026 (October 2026 meeting)
- Last change
- +25bp, in effect from 17 September 2026
- Changes since 1994
- 92: 52 rises, 40 cuts
- Highest since 2008
- 5.50% (upper end) from 27 July 2023; 7 changes since, net −150bp
Upcoming FOMC meeting dates
| Decision day | Meeting | Source |
|---|---|---|
| 9 Dec 2026 | December 2026 meeting | Federal Reserve, read 10 Nov 2026 |
| 27 Jan 2027 | January 2027 meeting | Federal Reserve, read 10 Nov 2026 |
| 17 Mar 2027 | March 2027 meeting | Federal Reserve, read 10 Nov 2026 |
| 28 Apr 2027 | April 2027 meeting | Federal Reserve, read 10 Nov 2026 |
| 9 Jun 2027 | June 2027 meeting | Federal Reserve, read 10 Nov 2026 |
| 28 Jul 2027 | July 2027 meeting | Federal Reserve, read 10 Nov 2026 |
| 15 Sep 2027 | September 2027 meeting | Federal Reserve, read 10 Nov 2026 |
| 27 Oct 2027 | October 2027 meeting | Federal Reserve, read 10 Nov 2026 |
| 8 Dec 2027 | December 2027 meeting | Federal Reserve, read 10 Nov 2026 |
The decision is announced on the last day of each meeting. Times, your time zone and calendar subscriptions: FOMC on our economic calendar. TradingLookup lists official dates. We don't publish rate forecasts or market-implied odds.
Static viewthe figures are written out beside this chart
Top of the target range at the end of each year, and now.
The target rate since 1994
Changes by year
| Year | Rises | Cuts | Net change |
|---|---|---|---|
| 2026 | 1 | 0 | +25bp |
| 2025 | 0 | 3 | −75bp |
| 2024 | 0 | 3 | −100bp |
| 2023 | 4 | 0 | +100bp |
| 2022 | 7 | 0 | +425bp |
| 2020 | 0 | 2 | −150bp |
| 2019 | 0 | 3 | −75bp |
| 2018 | 4 | 0 | +100bp |
| 2017 | 3 | 0 | +75bp |
| 2016 | 1 | 0 | +25bp |
| 2015 | 1 | 0 | +25bp |
| 2008 | 0 | 7 | −413bp |
| 2007 | 0 | 3 | −100bp |
| 2006 | 4 | 0 | +100bp |
| 2005 | 8 | 0 | +200bp |
| 2004 | 5 | 0 | +125bp |
| 2003 | 0 | 1 | −25bp |
| 2002 | 0 | 1 | −50bp |
| 2001 | 0 | 11 | −475bp |
| 2000 | 3 | 0 | +100bp |
| 1999 | 3 | 0 | +75bp |
| 1998 | 0 | 3 | −75bp |
| 1997 | 1 | 0 | +25bp |
| 1996 | 0 | 1 | −25bp |
| 1995 | 1 | 2 | 0bp |
| 1994 | 6 | 0 | +250bp |
Years with no change are left out. Net change is measured at the midpoint, so the move to a 0–0.25% range in December 2008 counts as −88bp, rounded.
Every change since 1994
| In effect from | New target | Change |
|---|---|---|
| 17 Sep 2026 | 3.75–4.00% | +25bp |
| 11 Dec 2025 | 3.50–3.75% | −25bp |
| 30 Oct 2025 | 3.75–4.00% | −25bp |
| 18 Sep 2025 | 4.00–4.25% | −25bp |
| 19 Dec 2024 | 4.25–4.50% | −25bp |
| 8 Nov 2024 | 4.50–4.75% | −25bp |
| 19 Sep 2024 | 4.75–5.00% | −50bp |
| 27 Jul 2023 | 5.25–5.50% | +25bp |
| 4 May 2023 | 5.00–5.25% | +25bp |
| 23 Mar 2023 | 4.75–5.00% | +25bp |
| 2 Feb 2023 | 4.50–4.75% | +25bp |
| 15 Dec 2022 | 4.25–4.50% | +50bp |
| 3 Nov 2022 | 3.75–4.00% | +75bp |
| 22 Sep 2022 | 3.00–3.25% | +75bp |
| 28 Jul 2022 | 2.25–2.50% | +75bp |
| 16 Jun 2022 | 1.50–1.75% | +75bp |
| 5 May 2022 | 0.75–1.00% | +50bp |
| 17 Mar 2022 | 0.25–0.50% | +25bp |
| 16 Mar 2020 | 0.00–0.25% | −100bp |
| 4 Mar 2020 | 1.00–1.25% | −50bp |
| 31 Oct 2019 | 1.50–1.75% | −25bp |
| 19 Sep 2019 | 1.75–2.00% | −25bp |
| 1 Aug 2019 | 2.00–2.25% | −25bp |
| 20 Dec 2018 | 2.25–2.50% | +25bp |
| 27 Sep 2018 | 2.00–2.25% | +25bp |
| 14 Jun 2018 | 1.75–2.00% | +25bp |
| 22 Mar 2018 | 1.50–1.75% | +25bp |
| 14 Dec 2017 | 1.25–1.50% | +25bp |
| 15 Jun 2017 | 1.00–1.25% | +25bp |
| 16 Mar 2017 | 0.75–1.00% | +25bp |
| 14 Dec 2016 | 0.50–0.75% | +25bp |
| 16 Dec 2015 | 0.25–0.50% | +25bp |
| 16 Dec 2008 | 0.00–0.25% | −88bp |
| 29 Oct 2008 | 1.00% | −50bp |
| 8 Oct 2008 | 1.50% | −50bp |
| 30 Apr 2008 | 2.00% | −25bp |
| 18 Mar 2008 | 2.25% | −75bp |
| 30 Jan 2008 | 3.00% | −50bp |
| 22 Jan 2008 | 3.50% | −75bp |
| 11 Dec 2007 | 4.25% | −25bp |
| 31 Oct 2007 | 4.50% | −25bp |
| 18 Sep 2007 | 4.75% | −50bp |
| 29 Jun 2006 | 5.25% | +25bp |
| 10 May 2006 | 5.00% | +25bp |
| 28 Mar 2006 | 4.75% | +25bp |
| 31 Jan 2006 | 4.50% | +25bp |
| 13 Dec 2005 | 4.25% | +25bp |
| 1 Nov 2005 | 4.00% | +25bp |
| 20 Sep 2005 | 3.75% | +25bp |
| 9 Aug 2005 | 3.50% | +25bp |
| 30 Jun 2005 | 3.25% | +25bp |
| 3 May 2005 | 3.00% | +25bp |
| 22 Mar 2005 | 2.75% | +25bp |
| 2 Feb 2005 | 2.50% | +25bp |
| 14 Dec 2004 | 2.25% | +25bp |
| 10 Nov 2004 | 2.00% | +25bp |
| 21 Sep 2004 | 1.75% | +25bp |
| 10 Aug 2004 | 1.50% | +25bp |
| 30 Jun 2004 | 1.25% | +25bp |
| 25 Jun 2003 | 1.00% | −25bp |
| 6 Nov 2002 | 1.25% | −50bp |
| 11 Dec 2001 | 1.75% | −25bp |
| 6 Nov 2001 | 2.00% | −50bp |
| 2 Oct 2001 | 2.50% | −50bp |
| 17 Sep 2001 | 3.00% | −50bp |
| 21 Aug 2001 | 3.50% | −25bp |
| 27 Jun 2001 | 3.75% | −25bp |
| 15 May 2001 | 4.00% | −50bp |
| 18 Apr 2001 | 4.50% | −50bp |
| 20 Mar 2001 | 5.00% | −50bp |
| 31 Jan 2001 | 5.50% | −50bp |
| 3 Jan 2001 | 6.00% | −50bp |
| 16 May 2000 | 6.50% | +50bp |
| 21 Mar 2000 | 6.00% | +25bp |
| 2 Feb 2000 | 5.75% | +25bp |
| 16 Nov 1999 | 5.50% | +25bp |
| 24 Aug 1999 | 5.25% | +25bp |
| 30 Jun 1999 | 5.00% | +25bp |
| 17 Nov 1998 | 4.75% | −25bp |
| 15 Oct 1998 | 5.00% | −25bp |
| 29 Sep 1998 | 5.25% | −25bp |
| 25 Mar 1997 | 5.50% | +25bp |
| 31 Jan 1996 | 5.25% | −25bp |
| 19 Dec 1995 | 5.50% | −25bp |
| 6 Jul 1995 | 5.75% | −25bp |
| 1 Feb 1995 | 6.00% | +50bp |
| 15 Nov 1994 | 5.50% | +75bp |
| 16 Aug 1994 | 4.75% | +50bp |
| 17 May 1994 | 4.25% | +50bp |
| 18 Apr 1994 | 3.75% | +25bp |
| 22 Mar 1994 | 3.50% | +25bp |
| 4 Feb 1994 | 3.25% | +25bp |
How it's built
- TargetFederal Reserve Board: federal funds target rate to 15 December 2008 (DFEDTAR), then the lower and upper ends of the target range (DFEDTARL, DFEDTARU), via FRED. Public domain.
- DatesThe date the new target took effect, as published. That is usually the day after the announcement.
- A changeAny day the target differs from the day before, including moves between scheduled meetings. Size measured at the range midpoint. Our count.
- Why 1994The FOMC began announcing its decisions in February 1994. FRED's earlier target values come from a researcher's reconstruction, so we leave them out.
- MeetingsFrom the Fed's own FOMC calendar page, read by the script behind our economic calendar.
Related: inflation and real rates · yield curve tracker · FOMC release times
Download the data
CSV and JSON, free to use, share and adapt under CC BY 4.0. Please credit TradingLookup and link to this page. Every file carries its build date; the source series are named in the JSON and on the data hub.
Embed the figures
Cite this
CC BY 4.0
Free to use, share and adapt under Creative Commons Attribution 4.0 (CC BY 4.0). Please credit TradingLookup and link to this page.
Suggested citation
TradingLookup (2026). Fed funds target rate history, v0.1, data to 10 November 2026. https://tradinglookup.com/data/fed-rate-history/. Source: Board of Governors of the Federal Reserve System.
Quotable line permanent link: /data/fed-rate-history/#stat
The Federal Reserve's federal funds target range was 3.75–4.00% on 10 November 2026, after a +25bp change that took effect on 17 September 2026; since 1994 the target has changed 92 times (52 rises, 40 cuts), according to TradingLookup's Fed rate history (November 2026).
Data, not advice. This page lists decisions already made and dates already set; it doesn't predict the next decision.
More TradingLookup data tools
- Is the yield curve inverted?US Treasury 10y–2y and 10y–3m spreads, every inversion since 1976. +0.32 pp · 10y minus 2y
- 5-year Treasury yieldThe US 5-year Treasury yield, daily since 1962, with its 52-week range. 4.67% · 5-year yield
- 10-year Treasury yield chartThe US 10-year Treasury yield, daily since 1962, with its 52-week range. 4.88% · 10-year yield
- Inflation and real ratesUS CPI and PCE inflation, the 10-year real yield and the breakeven rate. 3.7% · CPI inflation, Sept 2026
- Crypto and markets correlation matrixHow bitcoin and ether moved with the broad dollar index, yields and oil, 90 days and a year. −0.31 · bitcoin vs broad dollar index, 90 days
- Stablecoin supply, on-chainSupply of the main USD stablecoins, read from each token contract. $264.8bn · 8 stablecoins, 18 contracts
- State of retail CFD lossesWhat CFD providers' own risk warnings say, now and quarter by quarter since 2018. 73.5% · median provider (31), provisional
- Prop Firm Price IndexMonthly: the median cost to a funded $50K US futures prop account, one dated edition per month, using each firm's own price without a promo code where the page ties the shown price to a code. $170 · median, 39 of 50 firms, provisional
- State of prop firmsPrices, pass and payout rates and US access across our prop firm ledgers. 9 of 53 · firms that publish a pass rate, provisional
- Economic calendarCentral bank decisions and major data releases, dated from each publisher's own page. 25 Nov · next high-impact: US GDP
All of them, with every dataset: the data hub.